Posts

Week 16 - FINAL WEEK AI & INFOGRAPHICS

  FINAL WEEK AI & INFOGRAPHICS As this course comes to an end there is a lot to reflect on. AI can be a great field to focus and get training on. Jobs are now interested in the knowledge a person has with computers.  A job for AI is, "The Artificial Intelligence Engineer is an  IT expert  whose mission is to develop intelligent algorithms capable of learning, analyzing, and predicting future events. Their role is to create machines capable of reasoning like the human brain." This course has taught me to focus on the development of AI and how I can involve myself in this upcoming field as well as new training required at many employers that require this type of training.  Also, infographics have made an impact on me. To begin the number of places infographics are present and the way infographics can manipulate the outcome of an advertisement or any information being communicated. Having an infographic that is clear, interesting, and fun to look at makes ...

Week 14 - WHAT IS ARTIFICIAL INTELLIGENCE?

WHAT IS ARTIFICIAL INTELLIGENCE? So many of us still have no idea what is AI. How does it help? Hurt? According "hpe.com",  Early days of AI While its early forms enabled computers to play games like checkers against humans, AI is now part of our daily lives. We have AI solutions for quality control, video analytics, speech-to-text (natural language processing), and autonomous driving, as well as solutions in healthcare, manufacturing financial services, and entertainment. A powerful tool for businesses and organizations Artificial intelligence can be a very powerful tool for both large corporations generating significant data and small organizations that need to process their calls with customers more effectively. AI can streamline business processes, complete tasks faster, eliminate human error, and much more. AI at the edge HPE is pioneering a new frontier of AI by harnessing data and gaining insights at the edge. We empower success with real-time analytical AI for automat...

Week 13 - AI

Image
  Artificial intelligence  The way artificial intelligence has helped humans can also be argued it has damaged humans. The topic on its own is very much arguable. Many people appreciate what artificial intelligence has done for humans especially when it's related to molding organisms and natural selection but now that science is involved in nature it no longer is clean or organic. Having an organic meal is much more delicious, healthy, and expensive. Why is this? I believe now anything that takes longer in growing on its own without help from science is rare and cheaper. However, this should not be the case. We should be able to enjoy healthy food without making big financial sacrifices. The stigma that surrounds places like Whole Foods or Trader Joe's is "expensive or people with money shop there" this is unfair for those who wish they could eat healthy regularly. Artificial intelligence adds growth hormones into different plants and animals to give us more but at wh...

Week 12 - Charts

Image
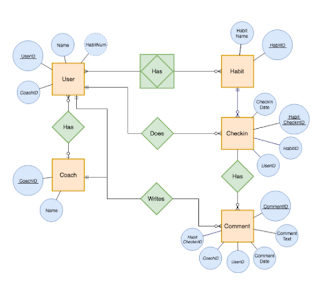
Entity Relationship Diagrams A clear chart can be effective between understanding various aspects including a simple recipe or an entire organization chart showing command hierarchy. It is important to have these charts within companies as well as part of an instruction manual. Step by step or relationship connectors are effective for many distinct aspects of life.  As we learn additional AI studies it is shown these relationship diagrams help computers connect different relationships or procedures therefore the intelligence gained by a machine can be compared to a human mind. Robots and self-driven cars have the intelligence to react to certain outside factors providing them with a real response, these responses are closed researched, I can envision relationship diagrams are used to give a clear path of direction for reactions.  As related to a company hierarchy the importance of these charts can assist in many different ways. As simple as a receptionist need to know who to...

Week 11 Job Market Prep

Image
Job Market Prep The job market is a very confusing place right now. Confusing to the extent depending on what type of job you are looking for there could be a very high possibility you can find it. This idea is depending on your skills and education it is possible to land a great job. It seems easy to obtain employment right now, after COVID lots of people quit their jobs or realized it was possible to work from home. Lots of people became creative and found ways of making money while being home. For a mom who has young kids, the pandemic became a chaotic time. Kids homeschooled or online school, preparing meals, keeping up with home. Working became the least of many people's worries. People left their jobs therefore the job market is at a good place right now for those who want to work.  On the opposite end, companies have taken the pandemic and so many technology developments to replace the jobs that have become obsolete. It is important now to familiarize ourselves with the most...

Tableau Public

Image
  Tableau Public is interesting and fun to use. It appears to me this is very similar to excel as far as the presentation goes it does seem enjoyable both to create and to use in a presentation. I would not mind using this for a future presentation where I need a visual similar to excel yet bringing more creativity and originality. The best part of Tableau is how simple it is to use. I tried to create a simple graph, the results did not disappoint me.  I tried to "compare" data in a visual the presentation was clear without the need for lots of explanations the point came across easily.  As I explored the website I came across the example below, which was my favorite. The colors and information are detailed yet simple to understand. Best graph I have ever seen. 

How to create an infographics

Image
 Creating an infographic begins by thinking of different ways to present my information. Important aspects of the infographics are presentation, relationship to the data, and attracting the preferred audience. So to begin I write down my ideas and create a plan. I picture the infographics and brainstorm where I will pull the data from and/or the pictures I would like to use to present. The next step is to then think about the audience I want to attract. It is important to consider the audience for me to present the information in the best way.  Once I type up my post, I search for the best pictures to represent the data I want to share. This step takes into consideration how I want to create the idea I have visualized. I save the pictures into my files, I place them on my infographic. The last step is to read my information to verify it is clear to understand. The information I write about has to relate to the pictures or graphs I used.  For this example, I am using a vis...

Week 8 - Think like a Designer

Image
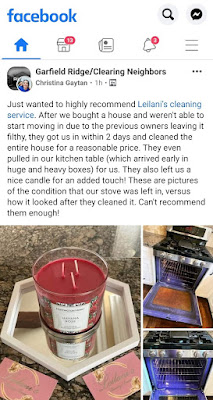
As I begin to the of a plan to make an infographic which will captivate and motivate a buyer to do business with my friends cleaning company will have actual information but will be presented in a way which should grasp the attention of anyone. The following ideas I have for the infographic I would like to design has the following two components, a visual of the actual work done by the company and information about the company that is easy to understand. The visual or picture of an actual cleaning of a house to show the work that the company provides. This will give the potential buyer an expectation of what the company has to offer.  Seeing the work might motivate the buyer to give the company a try. I feel when you see actual work you are more likely to want to try the work or the product the company offers. The second idea of posting actual information of the company might be a good way to have the potential buyer to get to know the company and become familiar with who owns it...

week 7 - Contact businesses

As I brainstormed on who to contact I thought of two close family friends who have their own business. I also wanted to look into contacting a non for profit which could use some help with marketing.  Person 1: My childhood friend owns his cleaning business where he offers both residential and commercial cleaning. After he lost his job due to covid he started his own business which in the last 6 months has grown tremendously. Most of his advertising has been done on social media. However, he also spent a great amount of time passing out flyers to different residential areas and businesses. I contacted him on Monday, October 11, we discussed how his business was going and I mentioned my school project. He was highly interested in my working on an infographics for his business. I mentioned I had a couple other people to contact but I would get back to him if I decided to work on his.  Person 2: My brothers ex-wife works a full time job and also has a bakery business which she ru...

Week 6 - REDO past blog

Image
Updated Infographics I posted my original blog about adult learning on me snapchat asking for feedback. Most of the feedback I received was towards the clarity of the presentation. Most people who responded mentioned it was unclear and had too much going on. I searched for a layout which would have less graphics but use the same wording. I felt it was straight to the point and did not feel so heavy. I also felt the lighter colors on the second infographic provided a calm feeling versus my original which was very strong and felt aggressive. As, this class advances I have begun to realize many different components when creating and infographics. Colors, pictures, and font make a huge different depending on what the topic is or who the audience are. My original infographics for Adult Learning gave most people a childish creative thinking whereas my second one was more focused towards adults and specifically women. 

Week5 - Vaccines

Image
 Vaccinations VS Non Vaccinations During this time in our life one of the most controversial discussions are those of people who are pro or con getting the vaccine. I used Piktochart to create the infographic providing information regarding vaccinations versus non-vaccinations.

How to Blog - Week 3

Image
 How to blog BALT 3318 INFOGRAPHICS Sept. 20, 2021 Blogging does not come easy to me. I do not feel blogging is something I enjoy, nor do I feel like any of my blogs are enjoyable. Since the start of this class, I have learned a few new concepts/ideas about blogging. I have also begun to understand the power of blogging and the message that is portrayed to the audience. I am very positive there is a lot more that I still do not understand or need more practice, but infographics is extremely intriguing to me.   Obtaining the attention from an audience who might make decision, understand concepts, learn ideas, or gain new information all by creating a method where you captivate someone's attention is amazing. I am always impressed by creative YouTubers or even recently TikTok members. These individuals could change someone's entire life by the way they present the message and the trust those watching them have towards them. To a certain level blog can hold the same power. Blog...

Week#3 Stats

Image
 Social Media Users      It is not a surprise to see the rising numbers on users across the world who are now members of some type of social media. Not having a social media account is considered "weird" or "strange". Most people log in to social media to document their feelings, show-off their new car or teach you how to cook quickly and deliciously. Anyone anywhere can join can a site and they are allowed to have an opinion about EVERYTHING. Nobody can escape the judgment social media users have towards everything we post. Most if not all my age friends can be found on either Facebook or Instagram. Some might have a LinkedIn and other might have a Tik-tok, but pretty much everyone can be found online. Many documentaries have been created in the last few years warning us about the effects of using social media on the youth, but I truly believe some adults should stay away from social media if they are emotionally immature or lack thick skin....

Adult Learning

Image
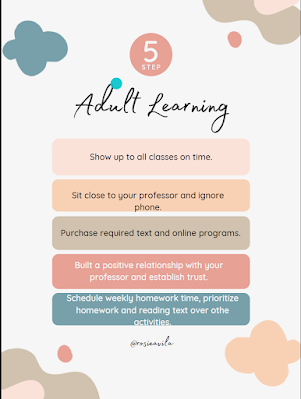
Adult Learning      Infographics is an easy way to learn the topic and highlights of the information without yet reading the entire paper. Pictures are easier to read and quickly get to the point. As I learn about the power of Infographics it amazes me how much we have seen during our lifetime displayed this and we ignored how powerful of an impact the displayed made upon us.  As I continue my education as an adult, I realize in each class I take how I can use the information from each class not only to obtain a better job with new knowledge but also how the world around us does so many different things to keep us focused. As an adult with children, it becomes especially difficult to spend the required time on school. I have done two to three classes at a time for a few years, I've learned a few ways to be successful in school while running a household and full-time employment.  The chances of being successful while in school are higher if you follow the followi...

Infographics BALT 318 Week 1

  Intro to Infographics New school year, new classes and exciting new ideas.  As we begin this new class I am getting familiar with LinkedIn, once again.   My name is Rosalba but I go by Rosie. I am working on my accounting degree.  Managing fulltime work, a growing family and school has been my life for a few years, I am excited to take this class and learn more about the ways pictures tell stories.